인터넷을 휘적거리다가 우연히 pycaret이라는 모듈을 발견했다.
아주 쉽고 간편하게 머신러닝을 돌릴 수 있도록 해준다.
소개란에도 뭐 대중화를 위해 만들었다고 한다~
https://pycaret.gitbook.io/docs/get-started/installation
Installation - PyCaret Official
With PyCaret, you can train models on GPU and speed up your workflow by 10x. To train models on GPU simply pass use_gpu = True in the setup function. There is no change in the use of the API, however, in some cases, additional libraries have to be installe
pycaret.gitbook.io
공식 사이트
버전이 잘 맞아야되는 듯하니 새롭게 가상환경을 만드는 것을 추천한다.
Jupyter notebook을 통한 연습을 하였다.
https://dacon.io/competitions/open/235539/overview/description
[재난] 타이타닉 : 누가 살아남았을까? - DACON
좋아요는 1분 내에 한 번만 클릭 할 수 있습니다.
dacon.io
머신러닝의 기본예제 중 하나인 타이타닉 문제!

데이터 info를 살펴보자 으음..영어 어렵구만..
- survived : 생존=1, 죽음=0
- pclass : 승객 등급. 1등급=1, 2등급=2, 3등급=3
- sibsp : 함께 탑승한 형제 또는 배우자 수
- parch : 함께 탑승한 부모 또는 자녀 수
- ticket : 티켓 번호
- cabin : 선실 번호
- embarked : 탑승장소 S=Southhampton, C=Cherbourg, Q=Queenstown
요종도로 정리가 가능하다.
데이터 프레임으로 살펴보자
tr.head()


항목별로 얼마나 있는지 궁금해졌다.
객실등급별 생존률 확인하기
1 : 생존, 0 : 사망
Survived 평균이 높을수록 생존률이 높다고 할 수 있다.
print("================================Survived_count================================")
print(tr['Survived'].value_counts(), "\n")
print("================================Pclass_count================================")
print(tr["Pclass"].value_counts(),"\n")
print("================================Embarked_count================================")
print(tr["Embarked"].value_counts(),"\n")
print("================================Sex_count================================")
print(tr["Sex"].value_counts(),"\n")
print("================================NULL_count================================")
print(tr.isnull().sum(),"\n")
================================Survived_count================================
0 549
1 342
Name: Survived, dtype: int64
================================Pclass_count================================
3 491
1 216
2 184
Name: Pclass, dtype: int64
================================Embarked_count================================
S 644
C 168
Q 77
Name: Embarked, dtype: int64
================================Sex_count================================
male 577
female 314
Name: Sex, dtype: int64
================================NULL_count================================
PassengerId 0
Survived 0
Pclass 0
Name 0
Sex 0
Age 177
SibSp 0
Parch 0
Ticket 0
Fare 0
Cabin 687
Embarked 2
dtype: int64 데이터 분포와 null값 등을 살펴볼 수 있다.
null값이 400개 이상들어가있는 행 제거 (절반이상 null이라면 의미없다고 판단)
tr.dropna(axis=1, thresh=400, inplace=True)dropna를 할때 thresh를 걸면 thresh갯수 이상의 null을 가진 열만 제거된다.(axis=1일경우)

print("Age null갯수 : ",tr['Age'].isnull().sum(),"\n")
print("Embarked null갯수 : ", tr["Embarked"].isnull().sum(),'\n')
Age의 빈값을 중앙값으로 채워넣었다.
median_age = tr['Age'].median(axis=0)
print(median_age)
tr['Age'].fillna(median_age, inplace=True)
print("Age null갯수 : ",tr['Age'].isnull().sum())
tr_caret = tr.drop(['PassengerId','Name','Ticket','Fare'], axis=1)쓸모없는 열은 지워버리고
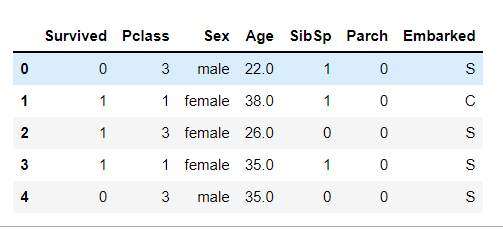
Sex정보가 지금 String으로 되어있는데 아주 거슬린다.
이를 처리하는 방법이 두가지가 있다. 하나는 숫자로 치환해주는 것.
또다른 하나는 원핫인코딩을 해주는것
1) 숫자로 치환하기
tr_caret['Sex'] = tr_caret['Sex'].map( {'female': 1, 'male': 0} ).astype(int)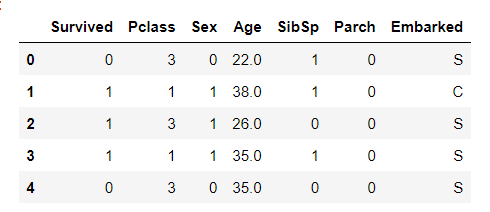
여성은 1, 남성은 0으로 바꼈다.
2) 원핫인코딩
sex_dum = pd.get_dummies(tr_caret['Sex'])
sex_dum = sex_dum.add_prefix('Sex_')
sex_dum
이경우 기존 컬럼을 삭제하고 합쳐야 한다.
tr_caret = tr_caret.drop(['Sex'], axis=1)
tr_caret = pd.concat([tr_caret, sex_dum], axis=1)
Embarked도 마찬가지로 진행할 수 있다.
다만 null값 제거를 안했기 때문에 숫자로 치환하는 경우엔 null값을 지우던가 채워줘야한다.
나이도 워낙 촘촘하기 때문에 분류하는데에 방해가 될 수 있다.
그래서 내맘대로 임의로 분류해주었다.
bins = [0,18,25,35,60,80]
group_n = ['Children','Youth','YoungAdult','MiddleAged','Senior']
age_cuts = pd.cut(tr_caret['Age'], bins, labels=group_n)
age_cuts
age_dum = pd.get_dummies(age_cuts)
age_dum = age_dum.add_prefix('Age_')
age_dum
나이를 지우고 원핫으로 바꾼 나이 집어넣기
tr_caret = tr_caret.drop(['Age'], axis=1)
tr_caret = pd.concat([tr_caret, age_dum], axis=1)
우왕 깔끔하게 숫자들로 데이터가 정리되었다.
이제 머신러닝을 돌려야하는데 여기서 pycaret의 진가가 발휘된다.
Survived를 예측하기 때문에 target은 Survived로 하겠다.
from pycaret.classification import *
s = setup(tr_caret, target = 'Survived')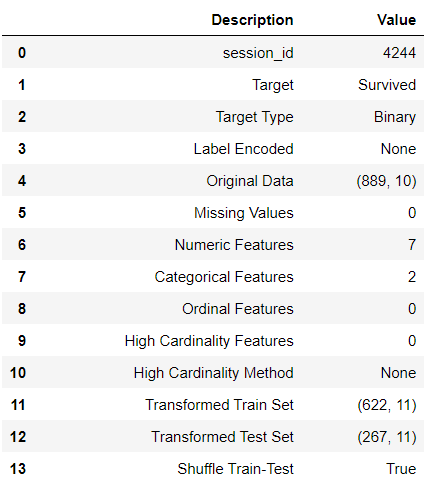
이런 식으로 데이터들에 대한 정보가 쫙 뜬다.
더 대박인건 다음
best = compare_models()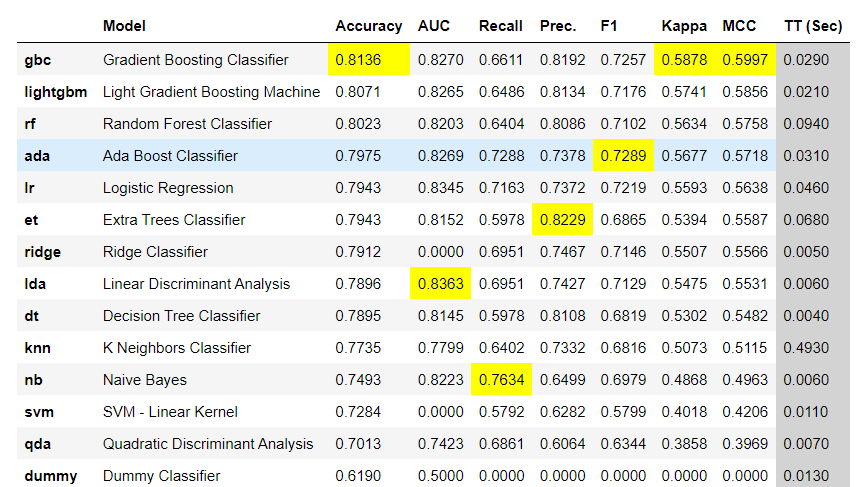
분류 모델들을 다 비교해준다. 정확도, AUC, F1_score 등 ...대단하다..
지금은 비교에서 정확도가 가장 높은 모델을 best로 저장했지만 내가 만약 Logistic Regression을 쓰고 싶다면
model_sample=create_model('lr')이렇게 해주면 Logistic Regression을 사용하게 된다.
여기서 끝나지 않는다.
evaluate_model(best)

위에 버튼이 생기는데

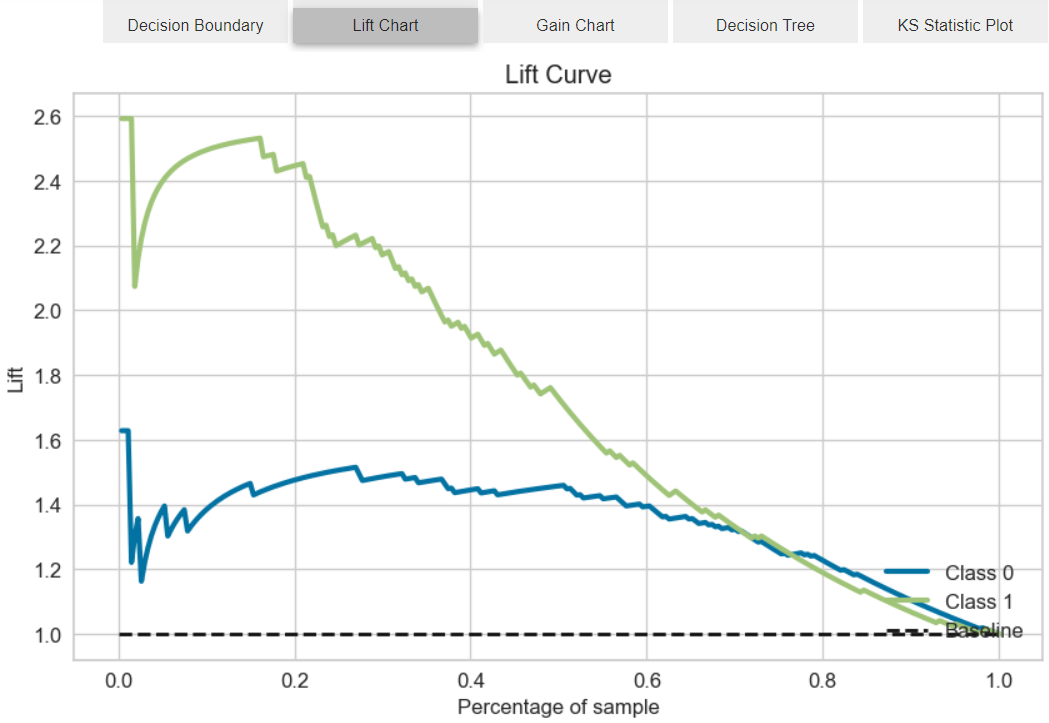
이처럼 다양한 지표들을 쉽게 확인할 수 있다.
넘어와서 모델을 사용해보면
predict_model(best)
predictions = predict_model(best, data=tr_caret)
predictions.head()
코드 두줄이면 된다.


IsAlone은 따로 처리한건데 큰 의미는 없었으니 포스팅하지 않았다.
여기서 모델의 저장도 가능하고 파이프라인도 확인 가능하다
save_model(best, 'my_best_pipeline')
random_state는 4244, max-depth=3 등 세부 지표도 확인가능하다. 물론 직접 설정하는 것이 더 좋은 경우도 있겠지만 간단하게 확인할 때 매우 유용한 모듈이라고 생각된다.
테스트데이터도 모두 전처리해주고 예측해보자
ts = pd.read_csv("test.csv")

ts.drop(['Cabin'],axis=1,inplace=True)

median_age = ts['Age'].median(axis=0)
ts['Age'].fillna(median_age, inplace=True)

ts_caret = ts.drop(['PassengerId','Name','Ticket','Fare'], axis=1)
ts_caret['Sex'] = ts_caret['Sex'].map( {'female': 1, 'male': 0} ).astype(int)
ts_caret= ts_caret.dropna()
ts_caret['Embarked'] = ts_caret['Embarked'].map( {'C': 2, 'Q': 1,'S':0} ).astype(int)

bins = [0,18,25,35,60,80]
group_n = ['Children','Youth','YoungAdult','MiddleAged','Senior']
age_cuts = pd.cut(ts_caret['Age'], bins, labels=group_n)
age_dum = pd.get_dummies(age_cuts)
age_dum = age_dum.add_prefix('Age_')

ts_caret = ts_caret.drop(['Age'], axis=1)
ts_caret = pd.concat([ts_caret, age_dum], axis=1)


ts_caret['FamilySize'] = ts_caret['SibSp'] + ts_caret['Parch'] + 1
ts_caret['IsAlone'] = 0
ts_caret.loc[ts_caret['FamilySize'] == 1, 'IsAlone'] = 1
ts_caret = ts_caret.drop(['Parch', 'SibSp', 'FamilySize'], axis=1)
loaded_model.predict(ts_caret)
prd=pd.DataFrame(loaded_model.predict(ts_caret))
prd.columns=['Survived']
prd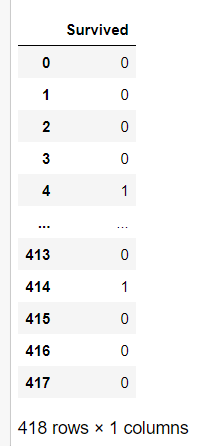
anw = pd.read_csv("submission.csv")
anw.drop(['Survived'],axis=1,inplace=True)
anw2 = pd.concat([anw,prd],axis=1)
anw2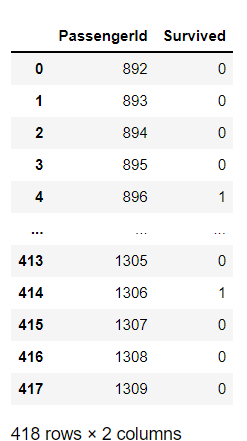
anw2.to_csv("답.csv", index=False)
간단한 전처리만으로도 0.7628의 AUC점수를 획득할 수 있었다.
===============================
sklearn으로 한 경우
# 머신러닝
from sklearn.linear_model import LogisticRegression
from sklearn.svm import SVC, LinearSVC
from sklearn.ensemble import RandomForestClassifier
from sklearn.neighbors import KNeighborsClassifier
from sklearn.naive_bayes import GaussianNB
from sklearn.linear_model import Perceptron
from sklearn.linear_model import SGDClassifier
from sklearn.tree import DecisionTreeClassifier

from sklearn.ensemble import RandomForestClassifier
from sklearn.model_selection import cross_val_score

rfc = RandomForestClassifier(n_estimators=10000, random_state=777)
edu_model = rfc.fit(tr_train, tr_label)
cross_val_score(rfc, tr_train, tr_label, cv=10).mean()
ans = pd.DataFrame(edu_model.predict(ts))
ans.columns=['Survived']
paper = pd.read_csv("submission.csv")
paper.drop(['Survived'],axis=1,inplace=True)
paper2 = pd.concat([paper,ans],axis=1)
paper2.to_csv("랜덤포레스트.csv", index=False)
acc_log = round(edu_model.score(tr_train, tr_label) *100,2)
acc_log
90.01
로지스틱회귀
logreg = LogisticRegression()
logreg.fit(tr_train, tr_label)
pred = pd.DataFrame(logreg.predict(ts))
pred.columns=['Survived']
paper = pd.read_csv("submission.csv")
paper.drop(['Survived'],axis=1,inplace=True)
paper2 = pd.concat([paper,pred],axis=1)
paper2.to_csv("로지스틱회귀.csv", index=False)
acc_log = round(logreg.score(tr_train, tr_label) *100,2)
acc_log
79.01
DecisionTree
tree = DecisionTreeClassifier()
tree.fit(tr_train, tr_label)
pred = pd.DataFrame(tree.predict(ts))
pred.columns=['Survived']
paper = pd.read_csv("submission.csv")
paper.drop(['Survived'],axis=1,inplace=True)
paper2 = pd.concat([paper,pred],axis=1)
paper2.to_csv("결정나무.csv", index=False)
acc_log = round(tree.score(tr_train, tr_label) *100,2)
acc_log
90.01
이와 같은식으로도 가능하긴하다. 좀더 정밀한 조정을 하면서 학습할 경우 이경우가 훨씬 좋긴하다.
p.s
Age null값을 최대한 분석해보려고 한 내용
for i in range(1,4):
    tt = p[(p['Pclass'] ==i) & (p['Sex']=='female')]['Age'].mean()
    print(f"{i}등급 여성 평균 나이 : ", tt)
print("\n")
for i in range(1,4):
    tt = p[(p['Pclass'] ==i) & (p['Sex']=='male')]['Age'].mean()
    print(f"{i}등급 남성 평균 나이 : ", tt)
1등급 여성 평균 나이 : 34.61176470588235
2등급 여성 평균 나이 : 28.722972972972972
3등급 여성 평균 나이 : 21.75
1등급 남성 평균 나이 : 41.28138613861386
2등급 남성 평균 나이 : 30.74070707070707
3등급 남성 평균 나이 : 26.507588932806325
tt = p[p['Age'].isnull()]
tt
'Study > Python' 카테고리의 다른 글
| [Python] 이중 리스트 하나로 합치기 (0) | 2022.03.21 |
|---|---|
| [Python]Sckit-Learn에 있는 데이터를 csv로 만들기 (0) | 2022.03.17 |
| Python groupyby 두가지 변수로 묶어서 정렬하기 (0) | 2021.12.01 |
| 폴더 속 모든 csv파일 하나의 dataframe으로 합치기 (0) | 2021.11.29 |
| [Python]for문 돌리면서 루프마다 새로운 변수 선언하기 (0) | 2021.11.12 |